
Previous: Snapshot
The National Wastewater Drug Monitoring Program (the Program) presents data on Australia’s drug consumption for 12 substances, including methylamphetamine, cocaine, heroin and 3,4-methylenedioxymethylamphetamine (MDMA), among a range of other illicit and licit substances.
The Program assists in understanding drug use within populations, providing a measure of the demand for a range of drugs. Illicit drugs and licit drugs with abuse potential are inherently harmful and reliable drug consumption data are a key indicator of levels of community harm. The ACIC partners with the universities of Queensland and Adelaide (formerly the University of South Australia) to deliver the Program.
Findings presented in wastewater reports provide law enforcement, policy, regulatory and health agencies with objective data on drug use. These data create opportunities to shape responses to the demand and supply sides of illicit drug markets, particularly in high-use areas, and can inform harm reduction strategies. They inform priority-setting that is responsive to constantly evolving drug markets domestically and internationally.
Longitudinal data captured by the Program increase our understanding of drug use nationally, in specific locations and over time. They provide valuable insight into trends and emerging issues in drug consumption across Australia and can identify new sources of risk. Further details about the drugs tested and program reporting are outlined below.
Australian drug markets: state of play
Program data provides unambiguous evidence that several of Australia’s most significant illicit drug markets continue to expand. In particular, in the 12 months ending in August 2025 all jurisdictions recorded increased consumption of methylamphetamine and cocaine to the highest levels recorded by the Program since it commenced in 2016. Heroin consumption increased substantially in some jurisdictions, with 5 recording the highest consumption levels recorded by the Program. The results for MDMA consumption were mixed across jurisdictions.
For methylamphetamine there has been an overall increasing trend in consumption nationally since August 2021. For cocaine, the trend commenced in August 2022. For MDMA the trend commenced in April 2022, however consumption has decreased since December 2024. In the case of heroin, a trend of general increase commenced in April 2023, but consumption has varied since December 2024.
The domestic trends are understandable in the context of global dynamics. For the past several years the world has seen record levels of cultivation and manufacture of cocaine and methylamphetamine, particularly from traditional source countries in the Americas and Asia. In the case of methylamphetamine, this is augmented by supplies from other source countries and sometimes sophisticated domestic manufacture. The Australian heroin market is supplied by relatively high-quality product, almost exclusively from South-East Asia. Restrictions imposed by the Taliban in Afghanistan on opium cultivation are not impacting the Australian market because Afghanistan is not a major source country for the Australian heroin market. There are indications that MDMA is being manufactured in Asia as well as Europe (and to a lesser extent in Australia) and this has potential implications for the Australian market. Australia’s demand for the 4 major drugs represents a very small component of the quantity of these drugs which is produced annually around the world. For the foreseeable future reliable supplies to Australia of high quality methylamphetamine, cocaine, MDMA and heroin is a given and there is potential for further increases in methylamphetamine and cocaine consumption. There are indications that consumption of MDMA may have plateaued and heroin consumption has fluctuated during 2025.
The intent and capability of SOC groups to service the Australian methylamphetamine, cocaine, MDMA and heroin markets is very high. Criminal groups are geographically dispersed across the world. Their resilience and sophistication challenges methods of disruption used by intelligence and law enforcement agencies globally. Much of the illegal activity perpetrated by these criminal groups is related to Australia’s highly profitable drug markets. Data in this report reinforce what the ACIC, law enforcement and departments of health have been indicating for some time on the basis of operational activity and treatment and forensic data in their respective jurisdictions – that Australia has plentiful supplies of methylamphetamine and cocaine in particular.
Australia’s National Drug Strategy 2017–26 is based on the 3 pillars of supply, demand and harm reduction. SOC was estimated to have cost Australia up to $82.3 billion in 2023–24, with illicit drugs accounting for almost a quarter ($19.0 billion). Demand for the major drugs is resilient and difficult to address. This will continue while Australian drug users choose to consume these substances and to pay premium prices in world terms for the drugs. Unlike heroin, for which there are opioid replacement therapy options available, it is widely recognised that effective pharmacotherapy treatment options for dependent users of methylamphetamine are limited. This creates challenges in addressing market demand.
Drug consumption snapshot
Average consumption of nicotine increased in both capital cities and regional areas between August 2024 and August 2025, with nicotine consumption increasing 4% nationally. For alcohol, average consumption decreased in capital cities between August 2024 and August 2025 and increased in regional areas.
Nicotine and alcohol aside, cannabis is the most consumed drug by a large margin, despite substantial fluctuations (Figure 1). Cannabis consumption in August 2025 decreased from the previous August.
Figure 1: National average drug consumption of cannabis, methylamphetamine, cocaine, MDMA, heroin, oxycodone and fentanyl.
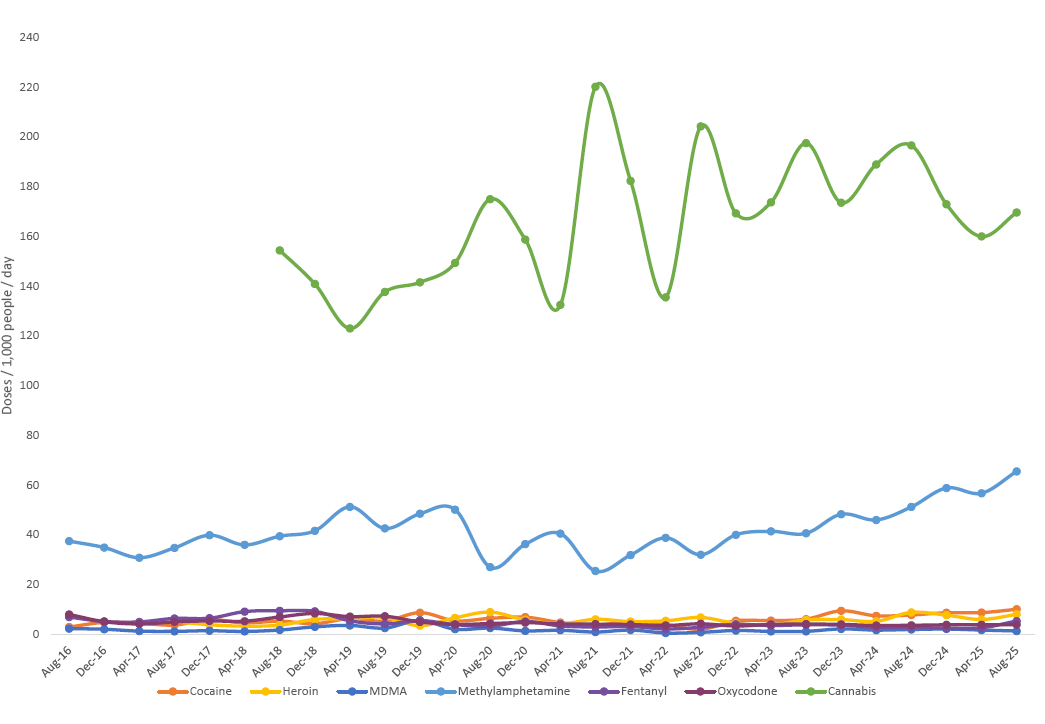
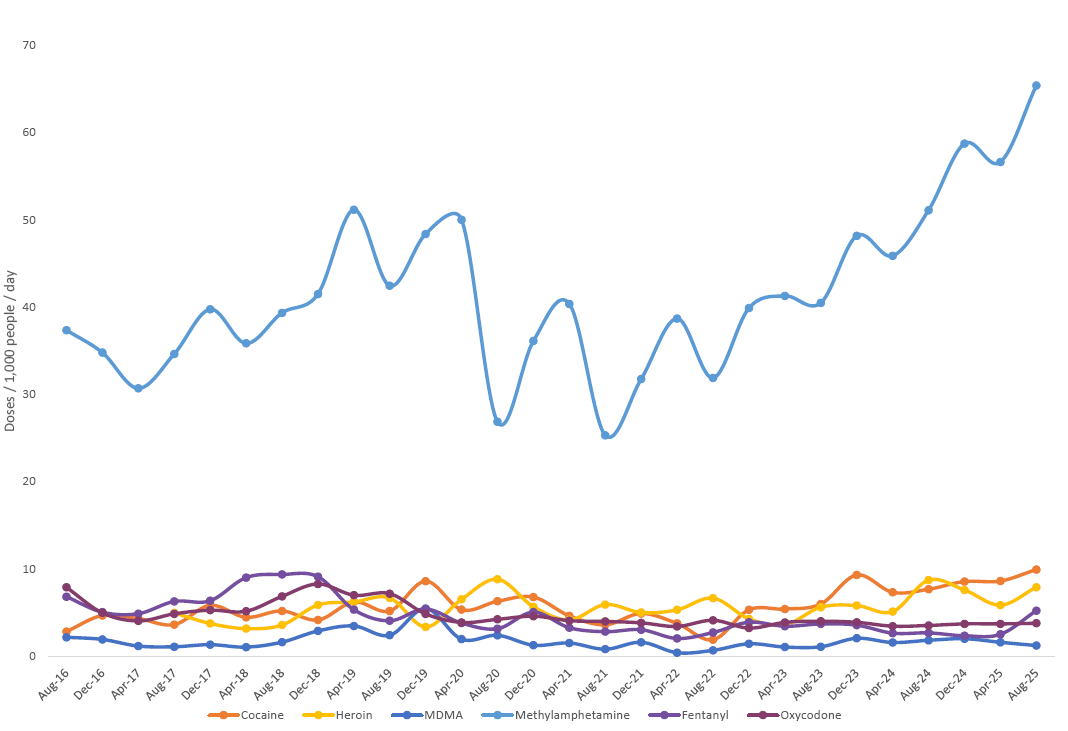
Methylamphetamine consumption increased and is at record levels. (Figures 1 and 2). Cocaine consumption also increased to a record level; however it remains substantially lower than methylamphetamine. MDMA consumption increased between August and December 2024, then decreased to August 2025 (Figure 2). Heroin consumption has fluctuated over the period. Of the pharmaceutical opioids, oxycodone consumption remained relatively stable, with fentanyl consumption increasing in August 2025 (Figure 2).
Figure 2: National average drug consumption of methylamphetamine, cocaine, MDMA, heroin, oxycodone and fentanyl.
A 9 year retrospective
With the passage of 9 years, sufficient data have now been collected by the Program to permit deep longitudinal analysis of consumption trends. Moreover, Program data have proven amenable to analysis from a variety of perspectives, including highlighting differences at the national versus regional levels, and differences in consumption between city and regional settings.
Throughout the life of the Program, national consumption of nicotine and alcohol far exceeded consumption of all other substances monitored. Moreover, cannabis consumption has exceeded by some margin consumption of all other illicit drugs.
As revealed in this Program report (2024-25), total national consumption of methylamphetamine, cocaine, MDMA and heroin was 26.8 tonnes, the highest combined weight recorded since the Program commenced in 2016.
The combined estimated national consumption of methylamphetamine, cocaine, MDMA and heroin increased 21% during the year to August 2025. This amounts to a 4.6 tonne increase in consumption from the year prior, driven by increases in all 4 drugs (Table 1). Methylamphetamine accounted for approximately 59% of the combined estimated consumption of these 4 drugs in the reporting period. By way of comparison, the next most consumed illicit stimulant, cocaine, accounted for approximately 30% of the combined consumption. The 15.7 tonnes of methylamphetamine, 7.9 tonnes of cocaine and 1.3 tonnes of heroin are record high estimated levels of consumption since the Program commenced.
| Drug | Estimated consumption (kilograms per annum) | % Change | |||||||||
|---|---|---|---|---|---|---|---|---|---|---|---|
| Year 1 2016–17 |
Year 2 2017–18 |
Year 3 2018–19 |
Year 4 2019–20 |
Year 5 2020–21 |
Year 6 2021–22 |
Year 7 2022–23 |
Year 8 2023–24 |
Year 9 2024–25 |
Year 8 to Year 9 | ||
| Meth |
8,405 |
9,847 |
11,516 |
11,147 |
8,838 |
9,018 |
10,585 |
12,815 |
15,791 |
23 | |
| Cocaine |
3,057 |
4,115 |
4,636 |
5,675 |
4,711 |
3,385 |
4,037 |
6,835 |
7,985 |
17 | |
| MDMA |
1,251 |
1,162 |
2,226 |
2,630 |
1,231 |
723 |
962 |
1,430 |
1,711 |
20 | |
| Heroin |
830a |
750 |
941 |
1,021 |
984 |
1,077 |
999 |
1,137 |
1,397 |
23 | |
| Total |
13,543 |
15,874 |
19,319 |
20,473 |
15,764 |
14,203 |
16,583 |
22,217 |
26,884 |
21b | |
a. Heroin estimates for Year 1 are based on one collection period.
b. This figure is not a summation of percentage change entries in this column, it represents the percentage difference in total consumption between Years 8 and 9 of the Program.
Program data also show fluctuating consumption over time for the drugs covered by the Program, including record high and low consumption of various drugs at different times since August 2016, emphasising that illicit drug markets do not operate in a consistent manner. However, there has been limited change over the life of the Program in the hierarchy of consumption of the 4 major illicit drugs. The only change that has occurred in the hierarchy over the life of the Program has been heroin overtaking MDMA in Years 6 and 7.
Value of drugs consumed
Using Program consumption data and the most recent national median price data available to the ACIC, it is possible to calculate the overall estimated street value of the major illicit drugs. In Year 9 (2024–25) the total market value of the 4 major illicit drugs of concern increased from $11.5 billion to a record $14.3 billion (Table 2). The methylamphetamine market, which has the highest value of the 4 drug types and where consumption increased by 23%, accounted for the majority of that expenditure, amounting to $11.05 billion (77% of the total estimated expenditure).
| Drug | Street value (A$) | ||||||||
|---|---|---|---|---|---|---|---|---|---|
| Year 1 2016–17 |
Year 2 2017–18 |
Year 3 2018–19 |
Year 4 2019–20 |
Year 5 2020–21 |
Year 6 2021–22 |
Year 7 2022–23 |
Year 8 2023–24 |
Year 9 2024–25 |
|
| Meth |
7.24b |
7.38b |
8.63b |
6.96b |
7.95b |
8.34b |
10.58b |
8.97b |
11.05b |
| Cocaine |
1.06b |
1.54b |
2.08b |
1.41b |
1.88b |
1.10b |
1.31b |
2.22b |
2.79b |
| MDMA |
145.59m |
114.19m |
211.08m |
226.72m |
95.50m |
62.32m |
99.51m |
147.93m |
174.52m |
| Heroin |
207.50m |
375.00m |
423.45m |
382.87m |
418.20m |
538.50m |
449.55m |
284.25m |
349.25m |
| Total |
8.6b |
9.4b |
11.3b |
8.9b |
10.3b |
10.0b |
12.4b |
11.5b |
14.3b |
Estimated state and territory consumption
At the state and territory level, consumption of methylamphetamine and cocaine increased in all jurisdictions in Year 9 to the highest levels recorded by the Program. Trends in consumption of MDMA and heroin varied (Tables 3 to 6). There were varying changes in methylamphetamine consumption across jurisdictions, with the estimated weight consumed in New South Wales increasing by almost a tonne and in Queensland by 720 kilograms. The estimated weight of cocaine consumed in Year 9 in New South Wales increased 500 kilograms. Consumption of MDMA varied nationally in Year 9, with decreased consumption in Victoria, Tasmania and the Australian Capital Territory. While heroin consumption decreased in the Australian Capital Territory, there was record consumption in 5 other jurisdictions.
| Jurisdiction | Estimated consumption (kilograms per annum) | % Change | |||||||||
|---|---|---|---|---|---|---|---|---|---|---|---|
| Year 1 | Year 2 | Year 3 | Year 4 | Year 5 | Year 6 | Year 7 | Year 8 | Year 9 | Year 8 to Year 9 | ||
| ACT |
80.3 |
93.0 |
119.4 |
122.1 |
93.2 |
83.2 |
93.9 |
118.9 |
155.1 |
30 | |
| NSW |
2,298.3 |
2,604.5 |
3,337.4 |
3,409.7 |
2,877.0 |
2,912.3 |
3,290.9 |
3,624.7 |
4,622.4 |
28 | |
| NT |
65.5 |
75.5 |
84.8 |
66.6 |
54.7 |
50.1 |
52.8 |
80.6 |
109.9 |
36 | |
| Qld |
1,277.5 |
1,893.3 |
2,247.7 |
2,246.8 |
1,608.8 |
1,650.7 |
1,953.8 |
2,509.4 |
3,230.9 |
29 | |
| SA |
1,005.3 |
1,159.5 |
943.2 |
980.5 |
838.5 |
775.9 |
938.6 |
1,124.4 |
1,425.8 |
27 | |
| Tas |
92.0 |
127.1 |
177.1 |
155.0 |
88.5 |
99.3 |
134.7 |
185.9 |
255.9 |
38 | |
| Vic |
2,039.2 |
2,477.7 |
3,124.6 |
2,980.2 |
2,307.9 |
2,502.2 |
2,798.6 |
3,455.2 |
3,846.0 |
11 | |
| WA |
1,547.3 |
1,416.8 |
1,482.7 |
1,186.2 |
969.9 |
944.8 |
1,322.3 |
1,716.4 |
2,145.6 |
25 | |
| Jurisdiction | Estimated consumption (kilograms per annum) | % Change | |||||||||
|---|---|---|---|---|---|---|---|---|---|---|---|
| Year 1 | Year 2 | Year 3 | Year 4 | Year 5 | Year 6 | Year 7 | Year 8 | Year 9 | Year 8 to Year 9 | ||
| ACT |
67.8 |
81.2 |
83.4 |
113.9 |
91.9 |
54.0 |
63.1 |
116.4 |
140.7 |
21 | |
| NSW |
1,812.3 |
2,397.8 |
2,548.0 |
2,988.2 |
2,374.5 |
1,622.9 |
1,933.7 |
2,784.6 |
3,287.2 |
18 | |
| NT |
19.0 |
27.4 |
22.8 |
20.9 |
12.4 |
7.6 |
9.7 |
31.2 |
42.4 |
36 | |
| Qld |
319.4 |
576.6 |
714.1 |
918.5 |
845.3 |
570.1 |
705.1 |
1,402.4 |
1,644.9 |
17 | |
| SA |
107.1 |
129.2 |
173.1 |
243.8 |
170.5 |
160.2 |
201.8 |
367.8 |
422.6 |
15 | |
| Tas |
10.9 |
15.5 |
16.6 |
26.8 |
35.1 |
29.2 |
24.5 |
50.7 |
60.9 |
20 | |
| Vic |
676.5 |
819.9 |
968.0 |
1,216.0 |
1,083.9 |
860.6 |
974.4 |
1,846.5 |
2,073.7 |
12 | |
| WA |
43.9 |
67.9 |
110.0 |
147.0 |
98.3 |
80.7 |
124.8 |
235.6 |
313.1 |
33 | |
| Jurisdiction | Estimated consumption (kilograms per annum) | % Change | |||||||||
|---|---|---|---|---|---|---|---|---|---|---|---|
| Year 1 | Year 2 | Year 3 | Year 4 | Year 5 | Year 6 | Year 7 | Year 8 | Year 9 | Year 8 to Year 9 | ||
| ACT |
28.4 |
14.4 |
36.5 |
38.6 |
17.8 |
6.5 |
10.5 |
14.5 |
14.3 |
-1 | |
| NSW |
462.8 |
450.5 |
834.7 |
986.1 |
446.1 |
234.2 |
334.0 |
511.8 |
761.9 |
49 | |
| NT |
37.8 |
24.1 |
32.4 |
46.4 |
32.1 |
13.7 |
8.5 |
16.3 |
29.2 |
79 | |
| Qld |
216.5 |
223.2 |
502.4 |
627.6 |
301.3 |
189.3 |
195.8 |
290.4 |
313.5 |
8 | |
| SA |
56.5 |
66.6 |
70.8 |
127.8 |
79.6 |
26.8 |
38.6 |
52.2 |
80.5 |
54 | |
| Tas |
30.6 |
16.7 |
54.9 |
54.1 |
31.0 |
12.4 |
22.8 |
36.0 |
35.2 |
-2 | |
| Vic |
319.6 |
291.3 |
511.9 |
479.0 |
232.0 |
194.3 |
285.1 |
398.5 |
360.1 |
-10 | |
| WA |
99.0 |
74.9 |
182.4 |
271.3 |
91.5 |
46.6 |
66.9 |
110.3 |
116.4 |
6 | |
| Jurisdiction | Estimated consumption (kilograms per annum) | % Change | |||||||||
|---|---|---|---|---|---|---|---|---|---|---|---|
| Year 1a | Year 2 | Year 3 | Year 4 | Year 5 | Year 6 | Year 7 | Year 8 | Year 9 | Year 8 to Year 9 | ||
| ACT |
14.7 |
15.3 |
10.3 |
16.9 |
15.3 |
17.3 |
22.6 |
26.1 |
22.2 |
-15 | |
| NSW |
264.6 |
222.2 |
307.0 |
323.9 |
356.9 |
389.6 |
366.4 |
444.4 |
626.7 |
41 | |
| NT |
1.0 |
1.0 |
1.0 |
1.4 |
1.6 |
1.1 |
1.0 |
1.2 |
1.8 |
50 | |
| Qld |
65.5 |
66.2 |
66.4 |
77.7 |
84.8 |
100.5 |
82.0 |
97.1 |
134.8 |
39 | |
| SA |
47.8 |
34.8 |
30.5 |
41.8 |
37.5 |
34.7 |
28.5 |
31.2 |
36.3 |
16 | |
| Tas |
3.3 |
4.5 |
2.8 |
4.3 |
5.4 |
3.2 |
3.1 |
5.1 |
5.5 |
8 | |
| Vic |
402.1 |
359.4 |
469.7 |
464.4 |
424.4 |
479.3 |
456.0 |
474.2 |
501.9 |
6 | |
| WA |
31.1 |
46.8 |
53.8 |
91.4 |
58.7 |
51.4 |
40.0 |
58.4 |
68.1 |
17 | |
a. Annual heroin consumption estimates for Year 1 are informed by data from only one collection period.
Implementation
The ACIC contracted The University of Queensland, and through it Adelaide University, to deliver the Program. Relationships have been built between the universities and the operators of wastewater facilities across Australia to permit collection and analysis of samples.1
In this report, Program wastewater analysis measured the presence2 of the following substances:
- methylamphetamine
- amphetamine
- cocaine
- 3,4-methylenedioxymethylamphetamine (MDMA)
- 3,4-methylenedioxyamphetamine (MDA)
- heroin
- cannabis
- oxycodone
- fentanyl
- nicotine
- alcohol
- ketamine.
The ACIC continues to review the range of monitored substances with its partners, stakeholders and universities.
Both contracted universities monitor wastewater across Australia, covering all state and territory capital cities and a range of regional cities and towns. In August 2025, 64 wastewater treatment plants participated nationally, covering 57% of the Australian population (Figure 3).3 Sites were selected to permit the ACIC to provide data on major population areas, to represent a cross-section of regional cities and towns and sites where treatment plant operators have established relationships with the universities.
Figure 3: Breakdown of sites by jurisdiction for August 2025.
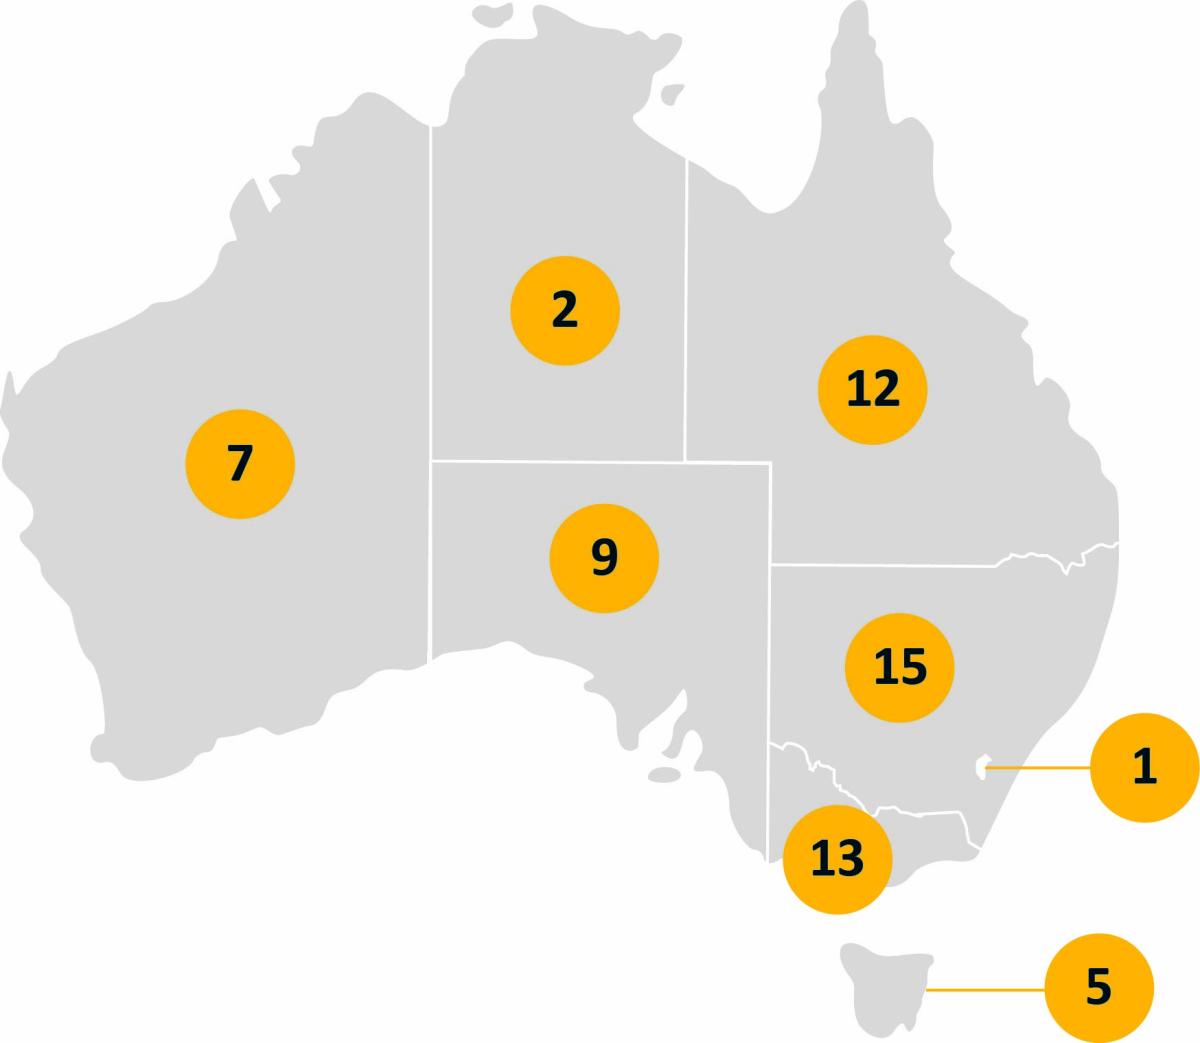
Participation by all states and territories is vital to informing our understanding of the national picture of drug use and demand. Although the location of sites within and between states and territories may change over the life of the Program, the intention is to ensure site continuity.
Reporting
In accordance with current wastewater analysis conventions, the terms of the contract and to protect the integrity of the Program, the exact locations of wastewater treatment plants sampled are not publicly released by the ACIC. Stakeholders in law enforcement, health and other relevant policy agencies are provided with classified information identifying actual sampling locations to inform appropriate responses.
Reported results reflect per capita use in all locations and, with the exception of MDMA and ketamine (for which reliable dose figures are unavailable), are expressed in terms of both the number of doses and the weight or volume consumed per capita of the respective substances, to facilitate comparison between substances.
International comparisons
The Program is based on a well-established, internationally recognised methodology. Wastewaterbased epidemiology has been standardised by a European network of laboratories focussed on quality sampling and analysis called the Sewage Core Group Europe (SCORE). The SCORE network facilitates an annual inter-laboratory testing program among participating laboratories that
research and measure illicit drugs in wastewater across the globe. As part of this routine laboratory benchmarking, participating laboratories which pass analytical criteria are invited to submit 7 days of wastewater data for their region in roughly the same time period, thus ensuring the quality of the analysis and comparability of reported data. The research teams at The University of Queensland and Adelaide University have taken part in and passed this testing regime for more than 6 years. As the methods are standardised internationally, this allows for the comparison of data between countries. Every batch of samples that is analysed domestically is subjected to 3 levels of quality controls comprising known amounts of authentic reference drug standards. These are analysed in duplicate to ensure accuracy and reproducibility. With substantial coverage (>50 sites), the estimates in Australia
are derived from a large proportion of the population and regular geographically diverse sampling.
The SCORE network permits comparison between analytical results obtained from countries in Europe, Oceania, North and South America. These results confirm the considerable per capita consumption of illicit stimulants in Australia, even in world terms, and that our illicit stimulant consumption is dominated by methylamphetamine.
Exploitation of Program data
Program data provide an important basis for the development of empirically-informed government and private sector policy and decision making. The reports provide unambiguous and detailed measures of the level of demand for the listed substances in the Australian population, complementing other drug datasets published in Australia.
Wastewater data are also particularly useful for identifying differences in levels of drug consumption in capital cities and regional areas of Australia. The data reinforces different dynamics that apply to both capital city and regional markets and illustrate drug consumption variations that exist within and between states and territories. Understanding these preferences is important in the development and delivery of national responses and in tailoring responses to suit the specific needs of individual jurisdictions. Wastewater analysis also permits the ACIC to gain insight into the decision-making of SOC groups that supply illicit drug markets.
Wastewater reporting enables the ACIC and partners to detect and respond to increasing drug threats. The number and diversity of regional sites that participate in the Program permit confident assessments to be made of drug trends outside of the capital cities that can be used to inform local responses. This is important because it allows wastewater data to complement a number of other Australian drug data collections that have limited regional coverage or are confined to capital cities. It also permits the ACIC and partners to speak with greater confidence about local drug threats.
Triangulated data show that domestic drug markets are complex and vary between jurisdictions, with external influences affecting markets in different ways at different time periods. Other Program data illustrate that consumption of the respective drugs also varies considerably at different sites within jurisdictions. It is important that Australian drug datasets are interpreted holistically.
When considering the whole spectrum of market indicators, the combined picture indicates concerning growth nationally, including in the markets for illicit stimulants. When coupled with seizure and detection data (both onshore and offshore), wastewater data provide an important indicator of the collective capacity and intentions of SOC groups. Also, demand is best understood at a population level and wastewater data lends itself to this. The level of drug consumption is the best and most reliable indicator of total illicit drug market size, noting that there may be short-term unmet demand, especially where drugs are largely (for example, methylamphetamine) or exclusively (cocaine and heroin) imported.
The ACIC engages with academic institutions, industry and public sector agencies to identify further data applications. Identified opportunities included informing responses in high-risk areas; measuring drug use in specific local areas; estimating the size of discrete illicit markets; and exploring options for monitoring the effectiveness of existing demand, supply and harm reduction initiatives. The Program is sufficiently flexible to allow for bespoke collection activity in different geographic locations and at
varying intervals in response to identified needs and objectives.
Benefits of the Program
Wastewater data are an important part of the national suite of datasets that increase understanding of drug consumption, demand and supply in Australian cities and regional locations. This report builds on national drug consumption data contained in preceding reports to identify trends over more than 9 years of drug use across states, territories and the nation.
The ACIC’s wastewater work extends far beyond the Program. We and our university partners continue to innovate and to generate additional applications for wastewater analysis. Moreover, wastewater analysis now routinely extends to a broader range of drugs than is reported in the Program for research and development purposes, which aids future understanding of emerging drug
market issues and responses.
Next: Research findings
- Errors/variation within the extraction and analysis methods exist for each drug type and across sampling locations, but are usually less than ±10%.
- The contract recognises that threshold levels are substance dependent and will vary accordingly. Refer to the research findings for further information on detection levels and whether it was possible to measure all substances.
- Sampling also occurred in October 2025 in capital city sites, with 18 participating wastewater sites nationally, covering approximately 44 per cent of the Australian population.